Code examples
Code Samples and Designs
Canvas demos, utility scripts, experiments, and generated visuals. The page keeps the examples easy to scan while images and code blocks stay readable on phone and desktop screens.
JS/HTML/CSS:
Gravity
Electrostatic
Solar
Falafel Catcher
Wave mouse cursor no Canvas
Random Walks
Random Walks with mouse Attractor
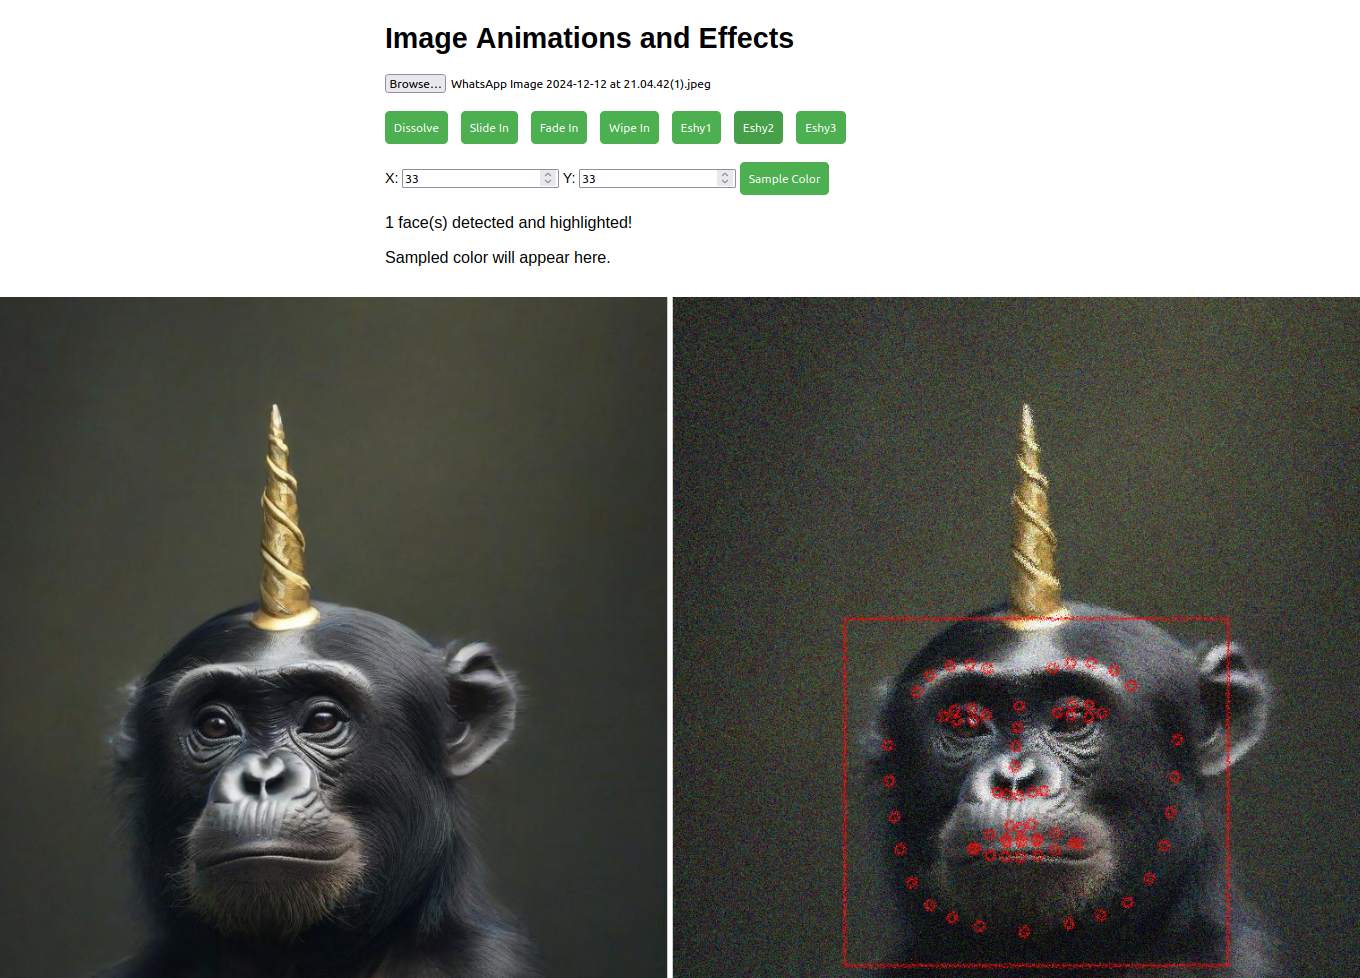
Eshy Dissolves
Useful Resources
snipopen.js – chatGPT4 tab script finds HTML blocks to run in a new tab.
BASH script that runs codes in a shell (under development) – requires a js script to run on the chatGPT window and dump the code snippets into files (click + so see code)
#!/bin/bash
# Directory to monitor
WATCH_DIR=”/home/e/Desktop/newFolder”
echo “Monitoring $WATCH_DIR for new files…”
# Monitor the directory for new files
inotifywait -m -e create “$WATCH_DIR” –format “%f” | while read NEW_FILE; do
# Full path to the new file
FILE_PATH=”$WATCH_DIR/$NEW_FILE”
echo “New file detected: $FILE_PATH”
# Extract the file extension
FILE_EXT=”${NEW_FILE##*.}”
# Determine the action based on the file extension
case “$FILE_EXT” in
html)
echo “HTML file detected. Opening in browser…”
xdg-open “$FILE_PATH”
;;
py)
echo “Python file detected. Running with Python…”
python3 “$FILE_PATH”
;;
java)
echo “Java file detected. Compiling and running…”
JAVA_FILE=”${NEW_FILE%.*}” # Remove .java extension for class name
javac “$FILE_PATH” && java -cp “$WATCH_DIR” “$JAVA_FILE”
;;
sh)
echo “Shell script detected. Executing…”
chmod +x “$FILE_PATH”
“$FILE_PATH”
;;
*)
echo “Unknown file type: .$FILE_EXT. Skipping.”
;;
esac
echo “Processing complete for $NEW_FILE.”
done
#!/bin/bash
# Directory to monitor
WATCH_DIR=”/home/e/Desktop/newFolder”
echo “Monitoring $WATCH_DIR for new files…”
# Monitor the directory for new files
inotifywait -m -e create “$WATCH_DIR” –format “%f” | while read NEW_FILE; do
# Full path to the new file
FILE_PATH=”$WATCH_DIR/$NEW_FILE”
echo “New file detected: $FILE_PATH”
# Extract the file extension
FILE_EXT=”${NEW_FILE##*.}”
# Determine the action based on the file extension
case “$FILE_EXT” in
html)
echo “HTML file detected. Opening in browser…”
xdg-open “$FILE_PATH”
;;
py)
echo “Python file detected. Running with Python…”
python3 “$FILE_PATH”
;;
java)
echo “Java file detected. Compiling and running…”
JAVA_FILE=”${NEW_FILE%.*}” # Remove .java extension for class name
javac “$FILE_PATH” && java -cp “$WATCH_DIR” “$JAVA_FILE”
;;
sh)
echo “Shell script detected. Executing…”
chmod +x “$FILE_PATH”
“$FILE_PATH”
;;
*)
echo “Unknown file type: .$FILE_EXT. Skipping.”
;;
esac
echo “Processing complete for $NEW_FILE.”
done
AI Is better than me at:
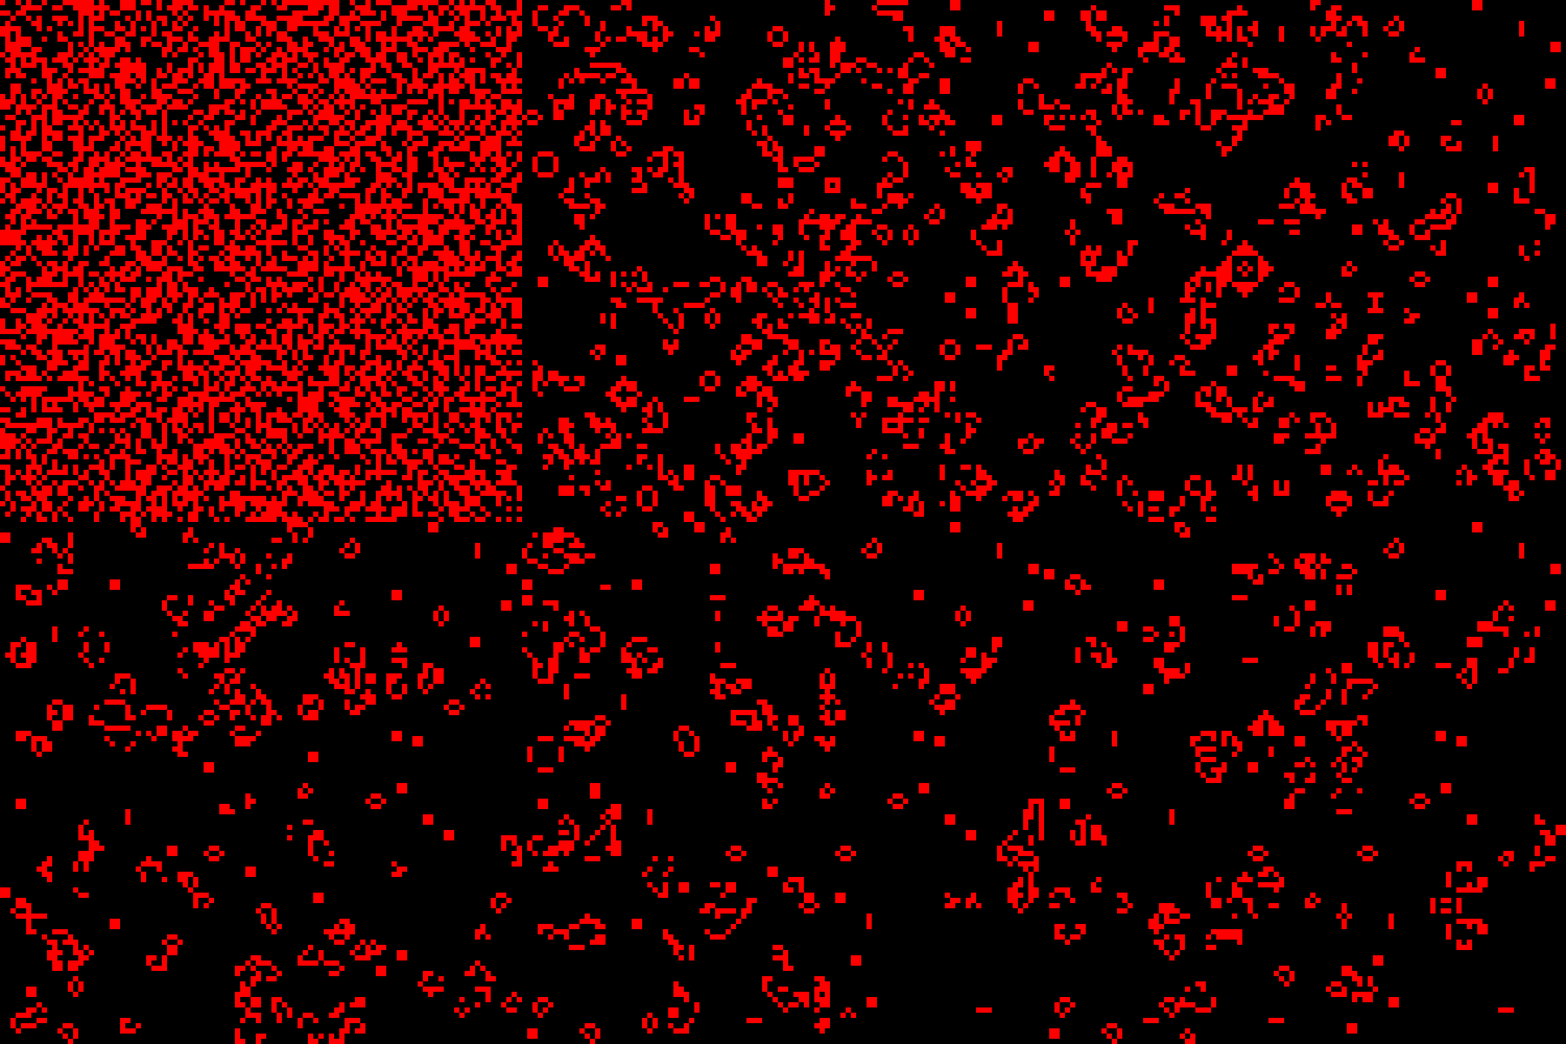
Canvas ops 1 – iteration ~40
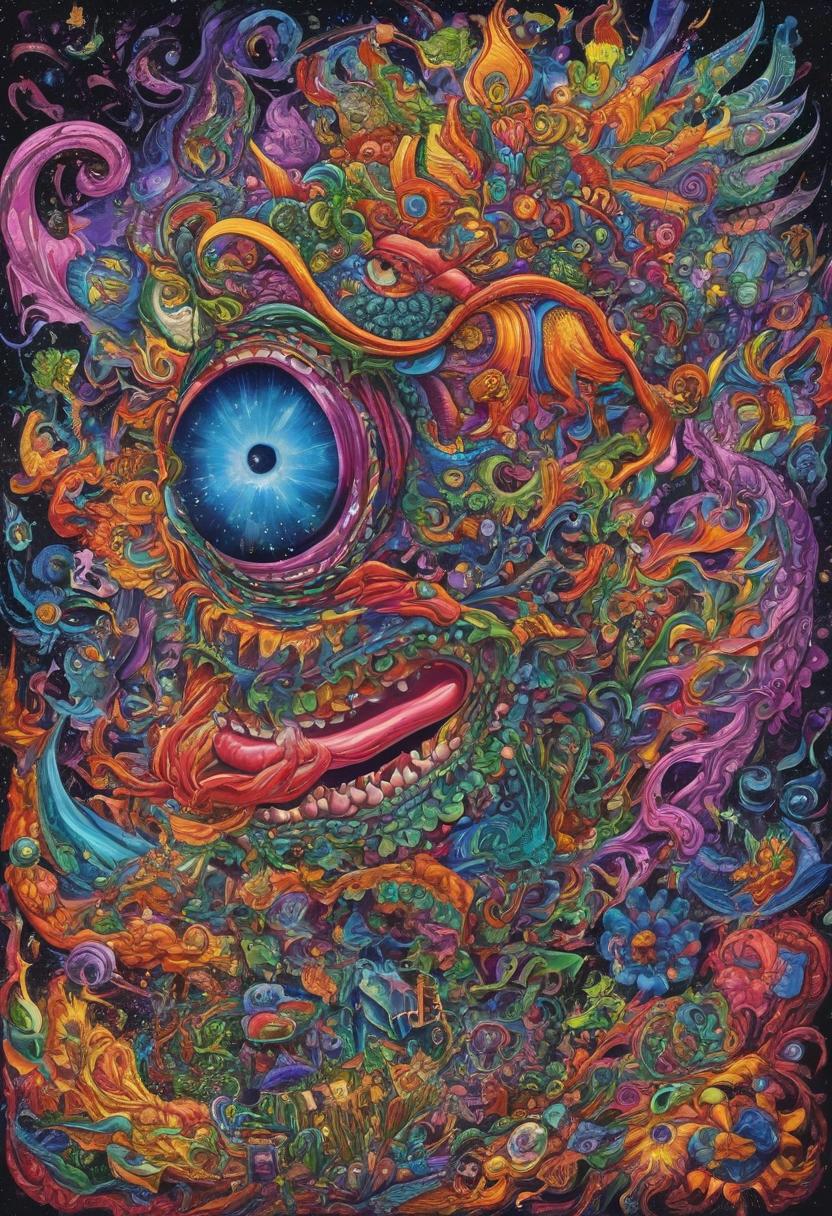
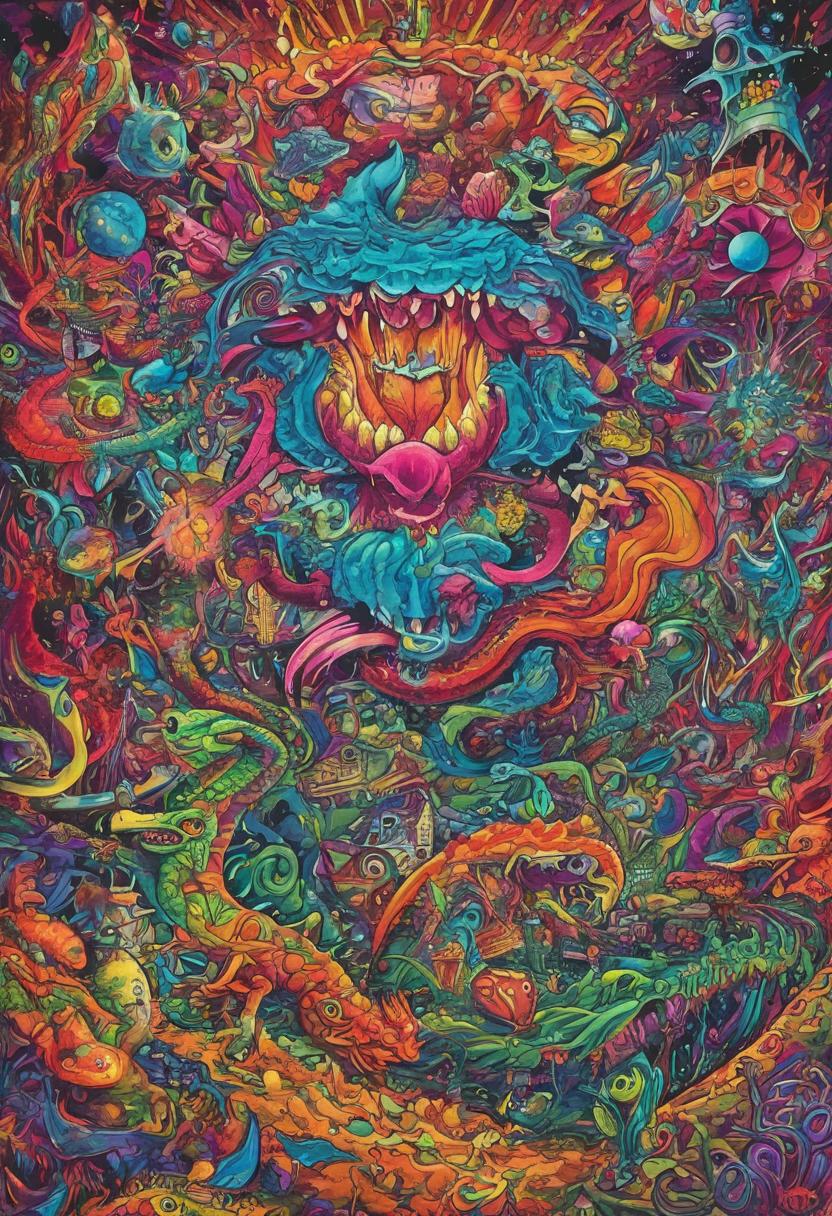
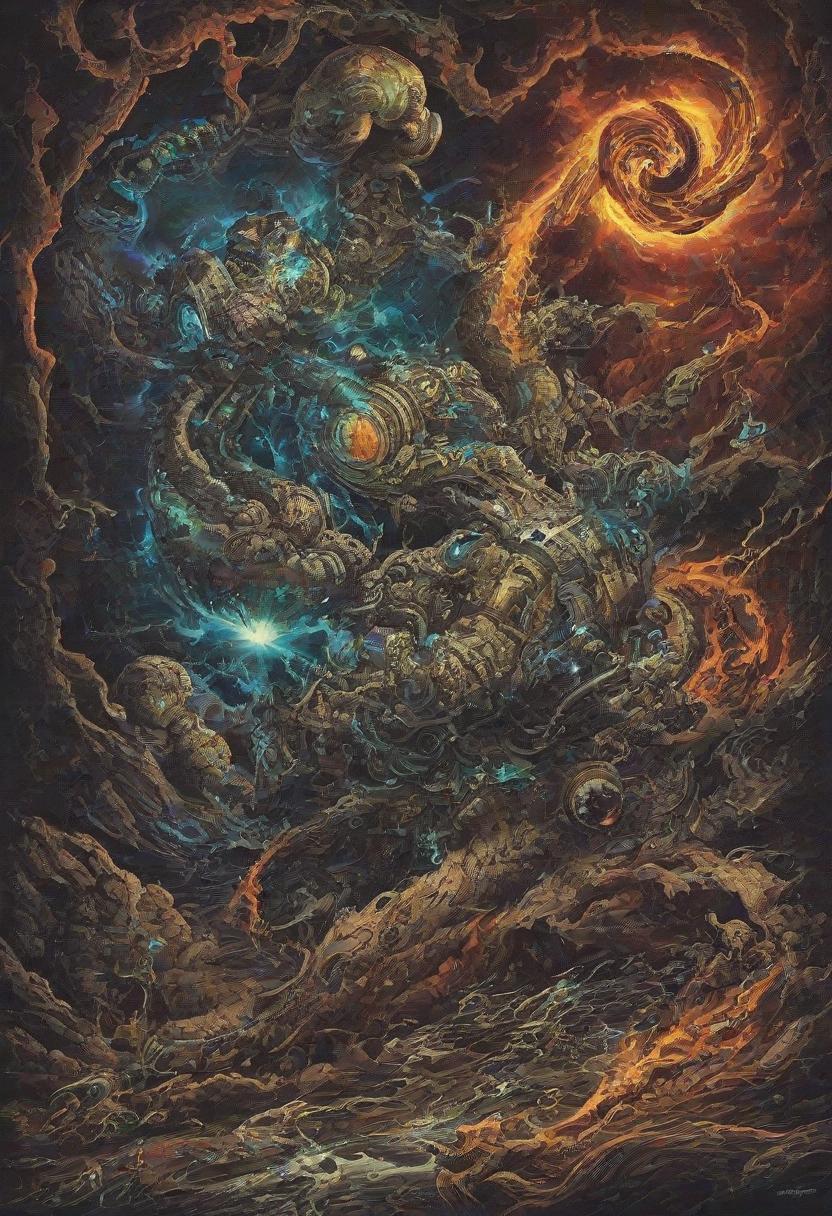
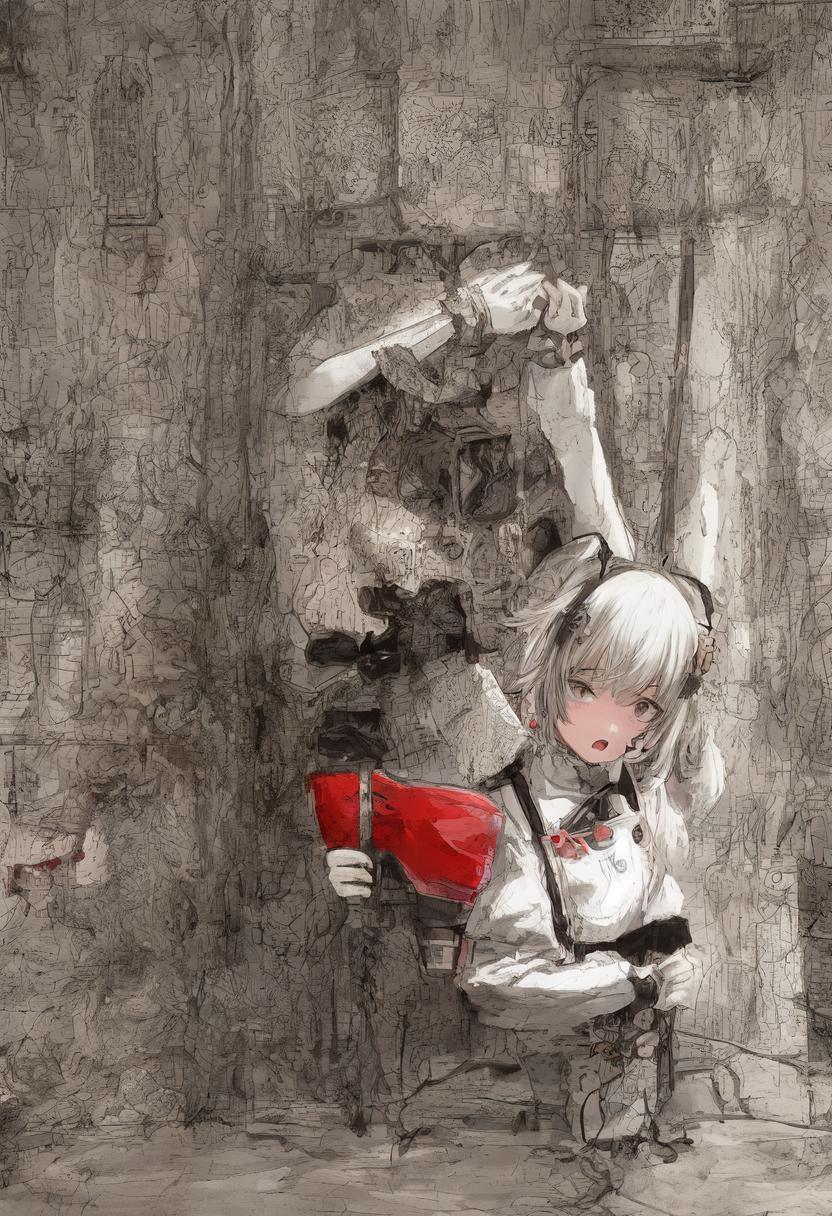
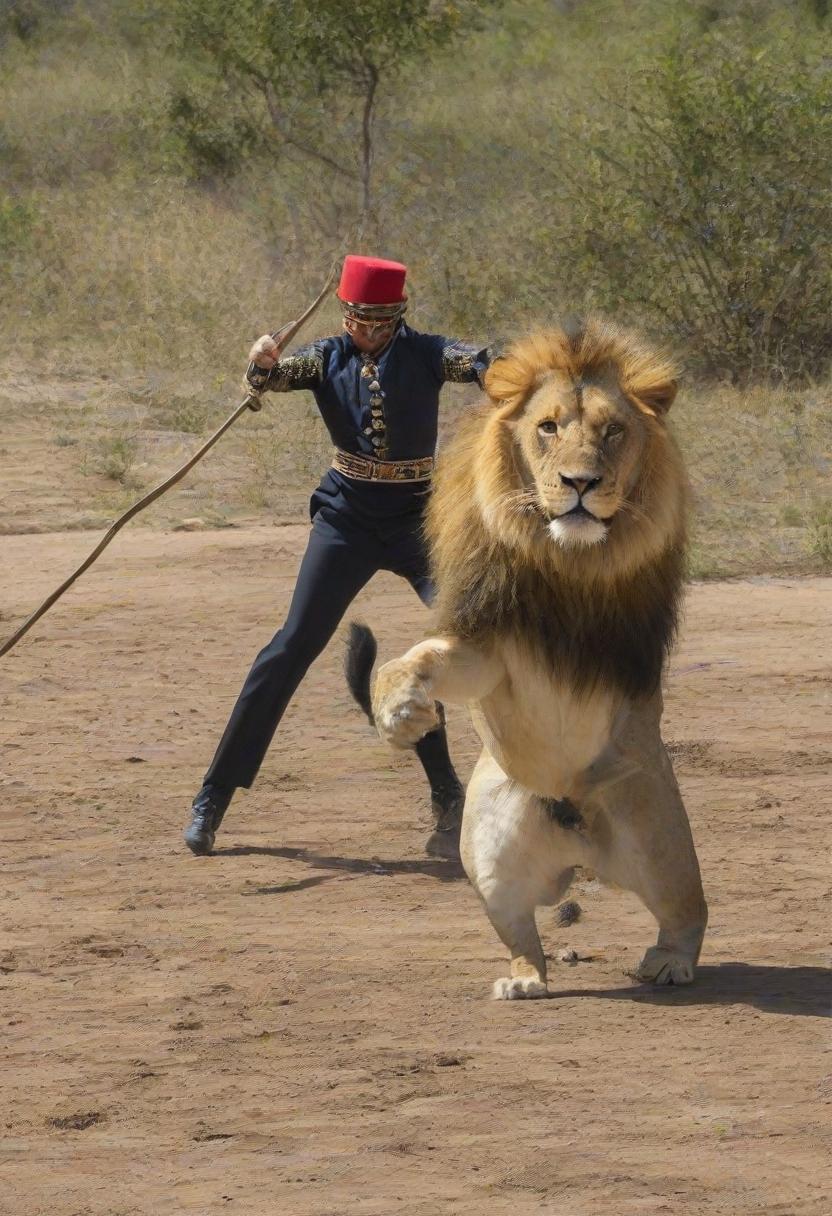
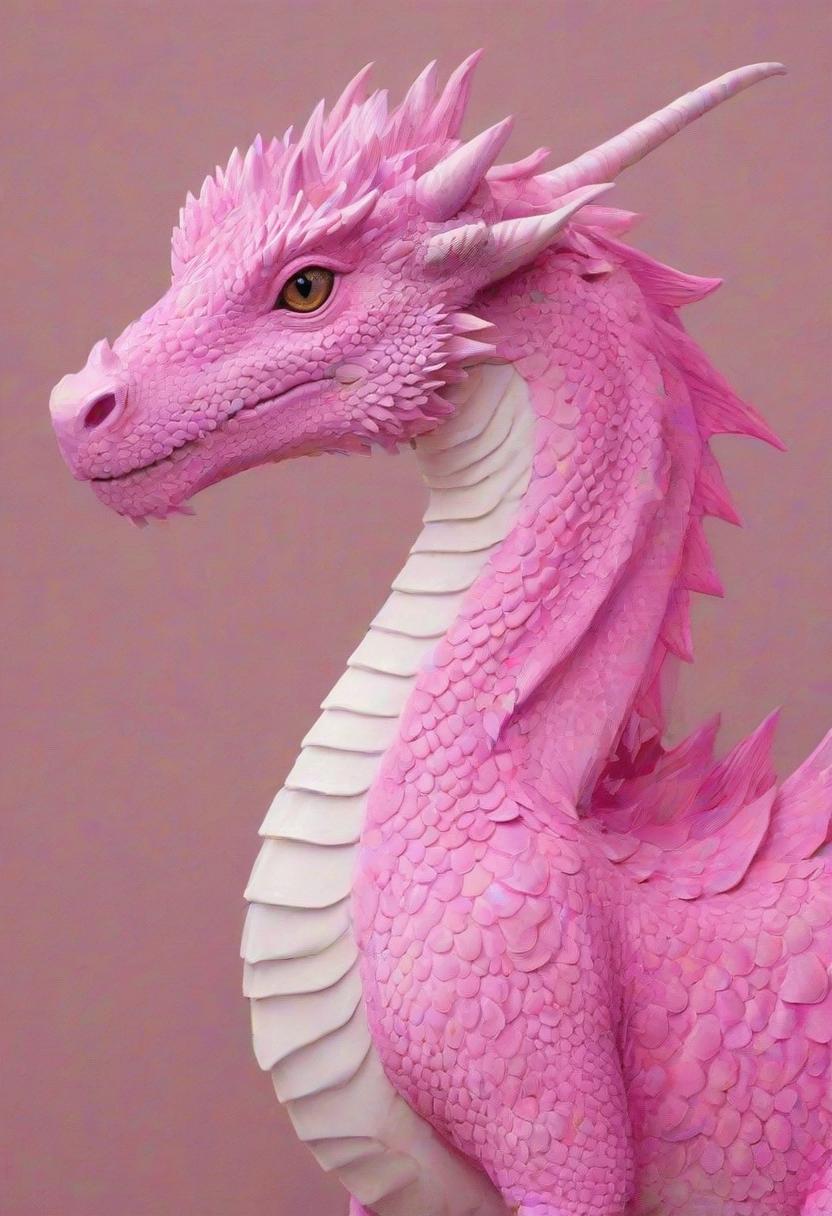
A.I. Images, Generated with Stable Diffusion







Dev&Fun
Python Seismic data to Seismogram
import sys
from obspy import read
import matplotlib.pyplot as plt
def fetch_seismogram(network, station, starttime, endtime):
“””
Fetch seismic data and plot a seismogram.
:param network: Network code (e.g., IU)
:param station: Station code (e.g., ANMO)
:param starttime: Start time in ISO 8601 format (e.g., 2025-01-02T07:26:14)
:param endtime: End time in ISO 8601 format (e.g., 2025-01-02T07:36:14)
“””
url = f”http://service.iris.edu/fdsnws/dataselect/1/query?network={network}&station={station}&starttime={starttime}&endtime={endtime}”
try:
# Read the MiniSEED data from the URL
print(f”Fetching data from: {url}”)
st = read(url)
# Plot the seismogram
print(“Plotting seismogram…”)
fig = st.plot(show=False, type=”relative”)
# Save the plot as an image file
output_file = f”{station}_seismogram.png”
fig.savefig(output_file)
print(f”Seismogram saved as {output_file}”)
except Exception as e:
print(f”Error: {e}”)
if __name__ == “__main__”:
if len(sys.argv) != 5:
print(“Usage: python fetch_seismogram.py <network> <station> <starttime> <endtime>”)
print(“Example: python fetch_seismogram.py IU ANMO 2025-01-02T07:26:14 2025-01-02T07:36:14”)
else:
network = sys.argv[1]
station = sys.argv[2]
starttime = sys.argv[3]
endtime = sys.argv[4]
fetch_seismogram(network, station, starttime, endtime)
#Run with:
# python d2s.py IU ANMO 2025-01-02T07:26:14 2025-01-02T07:36:14
import sys
from obspy import read
import matplotlib.pyplot as plt
def fetch_seismogram(network, station, starttime, endtime):
“””
Fetch seismic data and plot a seismogram.
:param network: Network code (e.g., IU)
:param station: Station code (e.g., ANMO)
:param starttime: Start time in ISO 8601 format (e.g., 2025-01-02T07:26:14)
:param endtime: End time in ISO 8601 format (e.g., 2025-01-02T07:36:14)
“””
url = f”http://service.iris.edu/fdsnws/dataselect/1/query?network={network}&station={station}&starttime={starttime}&endtime={endtime}”
try:
# Read the MiniSEED data from the URL
print(f”Fetching data from: {url}”)
st = read(url)
# Plot the seismogram
print(“Plotting seismogram…”)
fig = st.plot(show=False, type=”relative”)
# Save the plot as an image file
output_file = f”{station}_seismogram.png”
fig.savefig(output_file)
print(f”Seismogram saved as {output_file}”)
except Exception as e:
print(f”Error: {e}”)
if __name__ == “__main__”:
if len(sys.argv) != 5:
print(“Usage: python fetch_seismogram.py <network> <station> <starttime> <endtime>”)
print(“Example: python fetch_seismogram.py IU ANMO 2025-01-02T07:26:14 2025-01-02T07:36:14”)
else:
network = sys.argv[1]
station = sys.argv[2]
starttime = sys.argv[3]
endtime = sys.argv[4]
fetch_seismogram(network, station, starttime, endtime)
#Run with:
# python d2s.py IU ANMO 2025-01-02T07:26:14 2025-01-02T07:36:14
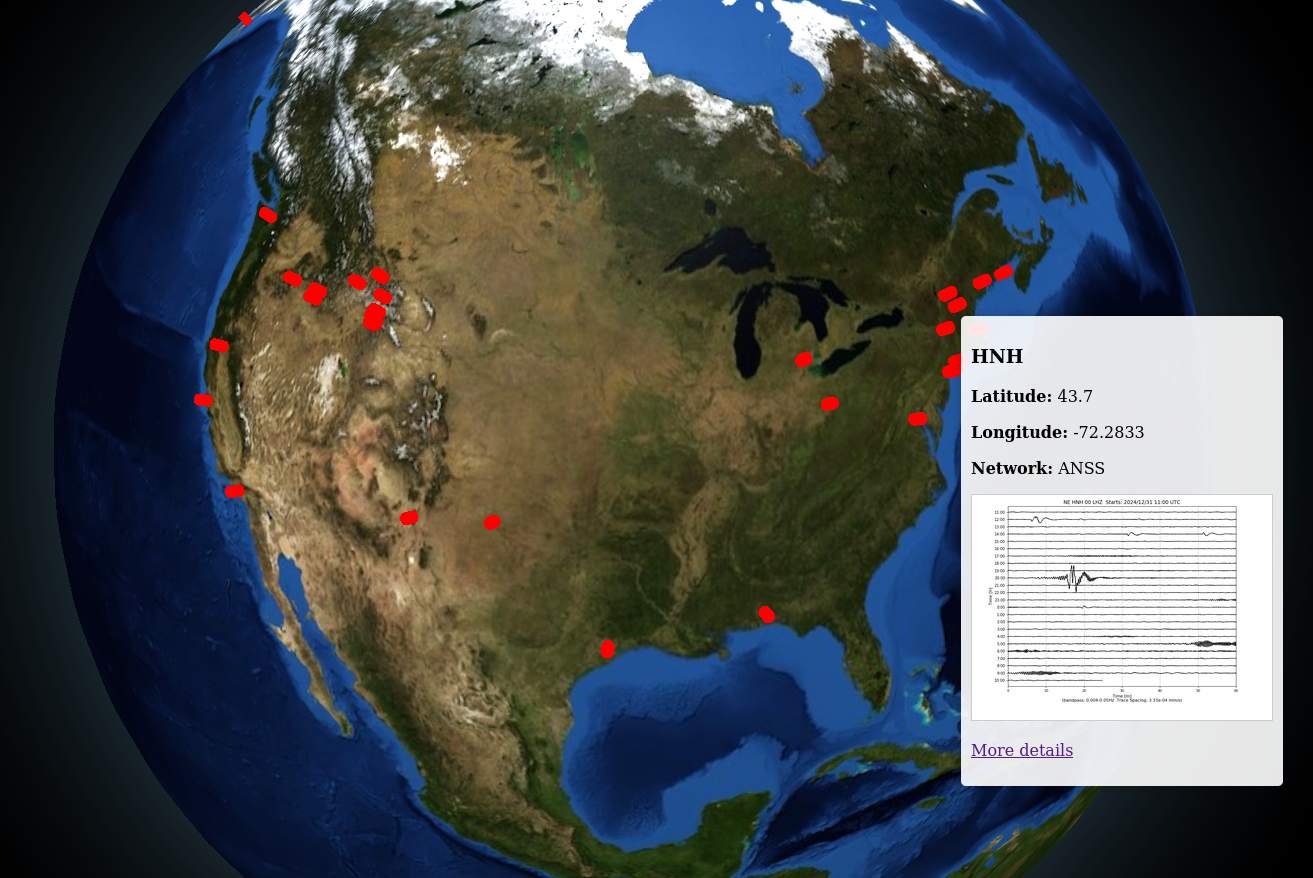
Seismographs globe v1 – iteration ~50 (not stable).
v0-v8 – show stations on globe.
v9 – added popups with station name and broken links to seismograms
v10-v15 resolving click recognition issues.
v16 – more stations added.
v17-v23 – reresolving click recognition issues (chatG–)
v24-v25 – ajaxification of the popups. also still having issues loading and click recognition issues.
v26 – popups show again, click reco no go.
(Also try
v0-v8 – show stations on globe.
v9 – added popups with station name and broken links to seismograms
v10-v15 resolving click recognition issues.
v16 – more stations added.
v17-v23 – reresolving click recognition issues (chatG–)
v24-v25 – ajaxification of the popups. also still having issues loading and click recognition issues.
v26 – popups show again, click reco no go.
(Also try
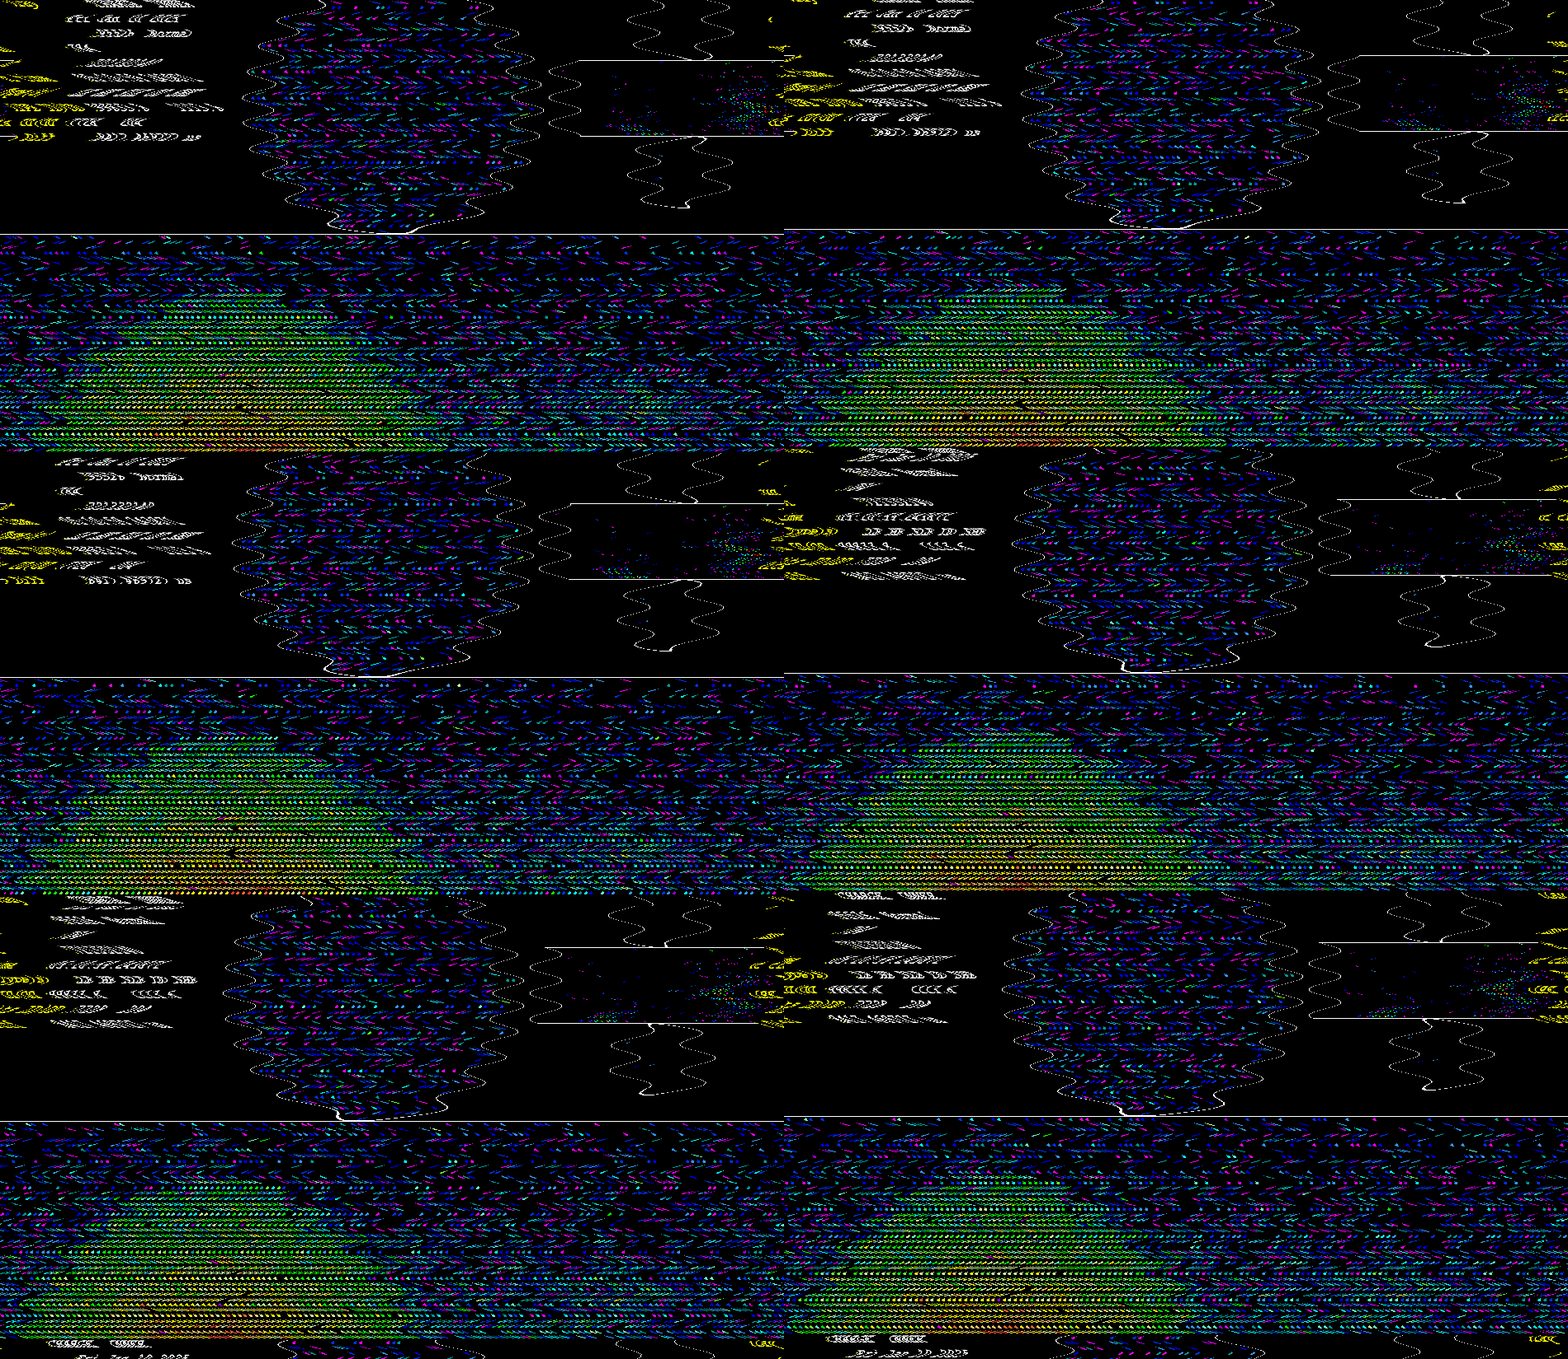
Python Super kamiokande gifs – takes the latest photomultiplier data visualization from Super Kamiokande and animates it.
import requests
from PIL import Image, ImageSequence
import numpy as np
from io import BytesIO
# Step 1: Download the Super-Kamiokande real-time data image
def download_image(url):
response = requests.get(url)
if response.status_code == 200:
return Image.open(BytesIO(response.content))
else:
raise Exception(f”Failed to download image: {response.status_code}”)
# Step 2: Crop the main rectangle from the image
def crop_main_rectangle(image):
# Adjust these coordinates to crop the main rectangle
left, top, right, bottom = 50, 50, 1000, 600
return image.crop((left, top, right, bottom))
# Step 3: Apply wave animation
def create_wave_animation(image, num_frames=30, wave_amplitude=20, wave_frequency=0.2):
image = image.convert(“RGB”) # Ensure the image is in RGB mode
image_array = np.array(image)
frames = []
for frame_idx in range(num_frames):
# Generate a wave effect
wave = wave_amplitude * np.sin(
(np.arange(image_array.shape[0]) + frame_idx * 5) * wave_frequency
)
wave = wave[:, np.newaxis]
# Apply the wave effect to shift pixel columns
disturbed_image = np.zeros_like(image_array)
for row_idx in range(image_array.shape[0]):
shift = int(wave[row_idx, 0])
disturbed_image[row_idx] = np.roll(image_array[row_idx], shift, axis=0)
# Move the entire image slightly left and up
disturbed_image = np.roll(disturbed_image, shift=-frame_idx, axis=0) # Move up
disturbed_image = np.roll(disturbed_image, shift=-frame_idx, axis=1) # Move left
# Convert back to an image and append to frames
disturbed_frame = Image.fromarray(disturbed_image, “RGB”) # Ensure RGB mode
frames.append(disturbed_frame)
return frames
# Step 4: Save the animation
def save_animation(frames, output_path):
frames[0].save(
output_path, save_all=True, append_images=frames[1:], duration=100, loop=0
)
print(f”Animation saved to {output_path}”)
# Main script
#super_kamiokande_url = “http://www-sk.icrr.u-tokyo.ac.jp/skdetsim/status_images/status_sensei.png”
super_kamiokande_url = “https://www-sk.icrr.u-tokyo.ac.jp/realtimemonitor/skev.gif”
output_gif_path = “super_kamiokande_wave_animation.gif”
try:
# Download the image
original_image = download_image(super_kamiokande_url)
print(“Image downloaded successfully.”)
# Crop the image
cropped_image = crop_main_rectangle(original_image)
print(“Image cropped successfully.”)
# Create the wave animation
frames = create_wave_animation(cropped_image)
print(“Wave animation created successfully.”)
# Save the animation
save_animation(frames, output_gif_path)
except Exception as e:
print(f”Error: {e}”)
import requests
from PIL import Image, ImageSequence
import numpy as np
from io import BytesIO
# Step 1: Download the Super-Kamiokande real-time data image
def download_image(url):
response = requests.get(url)
if response.status_code == 200:
return Image.open(BytesIO(response.content))
else:
raise Exception(f”Failed to download image: {response.status_code}”)
# Step 2: Crop the main rectangle from the image
def crop_main_rectangle(image):
# Adjust these coordinates to crop the main rectangle
left, top, right, bottom = 50, 50, 1000, 600
return image.crop((left, top, right, bottom))
# Step 3: Apply wave animation
def create_wave_animation(image, num_frames=30, wave_amplitude=20, wave_frequency=0.2):
image = image.convert(“RGB”) # Ensure the image is in RGB mode
image_array = np.array(image)
frames = []
for frame_idx in range(num_frames):
# Generate a wave effect
wave = wave_amplitude * np.sin(
(np.arange(image_array.shape[0]) + frame_idx * 5) * wave_frequency
)
wave = wave[:, np.newaxis]
# Apply the wave effect to shift pixel columns
disturbed_image = np.zeros_like(image_array)
for row_idx in range(image_array.shape[0]):
shift = int(wave[row_idx, 0])
disturbed_image[row_idx] = np.roll(image_array[row_idx], shift, axis=0)
# Move the entire image slightly left and up
disturbed_image = np.roll(disturbed_image, shift=-frame_idx, axis=0) # Move up
disturbed_image = np.roll(disturbed_image, shift=-frame_idx, axis=1) # Move left
# Convert back to an image and append to frames
disturbed_frame = Image.fromarray(disturbed_image, “RGB”) # Ensure RGB mode
frames.append(disturbed_frame)
return frames
# Step 4: Save the animation
def save_animation(frames, output_path):
frames[0].save(
output_path, save_all=True, append_images=frames[1:], duration=100, loop=0
)
print(f”Animation saved to {output_path}”)
# Main script
#super_kamiokande_url = “http://www-sk.icrr.u-tokyo.ac.jp/skdetsim/status_images/status_sensei.png”
super_kamiokande_url = “https://www-sk.icrr.u-tokyo.ac.jp/realtimemonitor/skev.gif”
output_gif_path = “super_kamiokande_wave_animation.gif”
try:
# Download the image
original_image = download_image(super_kamiokande_url)
print(“Image downloaded successfully.”)
# Crop the image
cropped_image = crop_main_rectangle(original_image)
print(“Image cropped successfully.”)
# Create the wave animation
frames = create_wave_animation(cropped_image)
print(“Wave animation created successfully.”)
# Save the animation
save_animation(frames, output_gif_path)
except Exception as e:
print(f”Error: {e}”)